"""
Special relativity simulation
"""

from relativity import RelativityGUI

import pyqtgraph as pg

pg.mkQApp()
win = RelativityGUI()
win.setWindowTitle("Relativity!")
win.resize(1100,700)
win.show()
win.loadPreset(None, 'Twin Paradox (grid)')

if __name__ == '__main__':
    pg.exec()
Verlet chain
"""
Mechanical simulation of a chain using verlet integration.

Use the mouse to interact with one of the chains.

By default, this uses a slow, pure-python integrator to solve the chain link
positions. Unix users may compile a small math library to speed this up by
running the `examples/verlet_chain/make` script.

"""

import numpy as np
import verlet_chain

import pyqtgraph as pg

sim = verlet_chain.ChainSim()

if verlet_chain.relax.COMPILED:
    # Use more complex chain if compiled mad library is available.
    chlen1 = 80
    chlen2 = 60
    linklen = 1
else:
    chlen1 = 10
    chlen2 = 8
    linklen = 8

npts = chlen1 + chlen2

sim.mass = np.ones(npts)
sim.mass[int(chlen1 * 0.8)] = 100
sim.mass[chlen1-1] = 500
sim.mass[npts-1] = 200

sim.fixed = np.zeros(npts, dtype=bool)
sim.fixed[0] = True
sim.fixed[chlen1] = True

sim.pos = np.empty((npts, 2))
sim.pos[:chlen1, 0] = 0
sim.pos[chlen1:, 0] = 10
sim.pos[:chlen1, 1] = np.arange(chlen1) * linklen
sim.pos[chlen1:, 1] = np.arange(chlen2) * linklen
# to prevent miraculous balancing acts:
sim.pos += np.random.normal(size=sim.pos.shape, scale=1e-3)

links1 = [(j, i+j+1) for i in range(chlen1) for j in range(chlen1-i-1)]
links2 = [(j, i+j+1) for i in range(chlen2) for j in range(chlen2-i-1)]
sim.links = np.concatenate([np.array(links1), np.array(links2)+chlen1, np.array([[chlen1-1, npts-1]])])

p1 = sim.pos[sim.links[:,0]]
p2 = sim.pos[sim.links[:,1]]
dif = p2-p1
sim.lengths = (dif**2).sum(axis=1) ** 0.5
sim.lengths[(chlen1-1):len(links1)] *= 1.05  # let auxiliary links stretch a little
sim.lengths[(len(links1)+chlen2-1):] *= 1.05
sim.lengths[-1] = 7

push1 = np.ones(len(links1), dtype=bool)
push1[chlen1:] = False
push2 = np.ones(len(links2), dtype=bool)
push2[chlen2:] = False
sim.push = np.concatenate([push1, push2, np.array([True], dtype=bool)])

sim.pull = np.ones(sim.links.shape[0], dtype=bool)
sim.pull[-1] = False

# move chain initially just to generate some motion if the mouse is not over the window
mousepos = np.array([30, 20])


def display():
    global view, sim
    view.clear()
    view.addItem(sim.makeGraph())

def relaxed():
    global app
    display()
    app.processEvents()

def mouse(pos):
    global mousepos
    pos = view.mapSceneToView(pos)
    mousepos = np.array([pos.x(), pos.y()])

def update():
    global mousepos
    #sim.pos[0] = sim.pos[0] * 0.9 + mousepos * 0.1
    s = 0.9
    sim.pos[0] = sim.pos[0] * s + mousepos * (1.0-s)
    sim.update()

app = pg.mkQApp()
win = pg.GraphicsLayoutWidget()
win.show()
view = win.addViewBox()
view.setAspectLocked(True)
view.setXRange(-100, 100)
#view.autoRange()

view.scene().sigMouseMoved.connect(mouse)

#display()
#app.processEvents()

sim.relaxed.connect(relaxed)
sim.init()
sim.relaxed.disconnect(relaxed)

sim.stepped.connect(display)

timer = pg.QtCore.QTimer()
timer.timeout.connect(update)
timer.start(16)

if __name__ == '__main__':
    pg.exec()
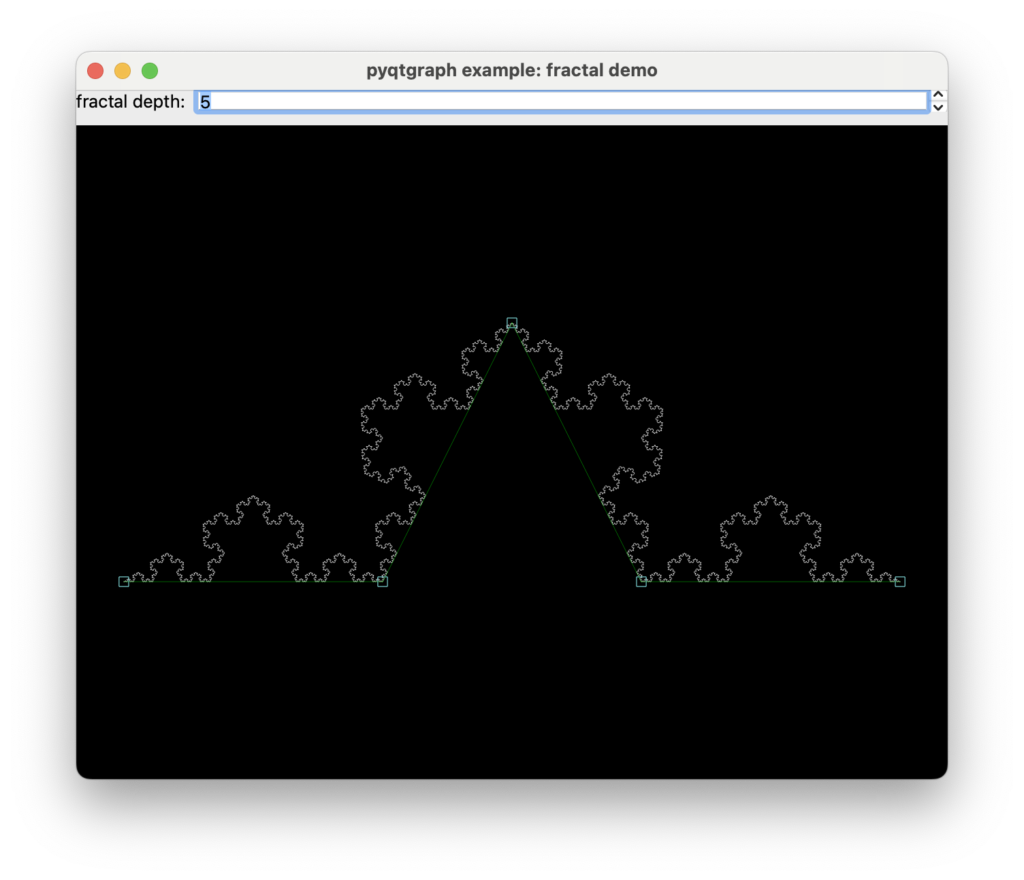
Koch Fractal
"""
Displays an interactive Koch fractal
"""

from functools import reduce

import numpy as np

import pyqtgraph as pg

app = pg.mkQApp("Fractal Example")

# Set up UI widgets
win = pg.QtWidgets.QWidget()
win.setWindowTitle('pyqtgraph example: fractal demo')
layout = pg.QtWidgets.QGridLayout()
win.setLayout(layout)
layout.setContentsMargins(0, 0, 0, 0)
depthLabel = pg.QtWidgets.QLabel('fractal depth:')
layout.addWidget(depthLabel, 0, 0)
depthSpin = pg.SpinBox(value=5, step=1, bounds=[1, 10], delay=0, int=True)
depthSpin.resize(100, 20)
layout.addWidget(depthSpin, 0, 1)
w = pg.GraphicsLayoutWidget()
layout.addWidget(w, 1, 0, 1, 2)
win.show()

# Set up graphics
v = w.addViewBox()
v.setAspectLocked()
baseLine = pg.PolyLineROI([[0, 0], [1, 0], [1.5, 1], [2, 0], [3, 0]], pen=(0, 255, 0, 100), movable=False)
v.addItem(baseLine)
fc = pg.PlotCurveItem(pen=(255, 255, 255, 200), antialias=True)
v.addItem(fc)
v.autoRange()


transformMap = [0, 0, None]


def update():
    # recalculate and redraw the fractal curve

    depth = depthSpin.value()
    pts = baseLine.getState()['points']
    nbseg = len(pts) - 1
    nseg = nbseg**depth

    # Get a transformation matrix for each base segment
    trs = []
    v1 = pts[-1] - pts[0]
    l1 = v1.length()
    for i in range(len(pts)-1):
        p1 = pts[i]
        p2 = pts[i+1]
        v2 = p2 - p1
        t = p1 - pts[0]
        r = v2.angle(v1)
        s = v2.length() / l1
        trs.append(pg.SRTTransform({'pos': t, 'scale': (s, s), 'angle': r}))

    basePts = [np.array(list(pt) + [1]) for pt in baseLine.getState()['points']]
    baseMats = np.dstack([tr.matrix().T for tr in trs]).transpose(2, 0, 1)

    # Generate an array of matrices to transform base points
    global transformMap
    if transformMap[:2] != [depth, nbseg]:
        # we can cache the transform index to save a little time..
        nseg = nbseg**depth
        matInds = np.empty((depth, nseg), dtype=int)
        for i in range(depth):
            matInds[i] = np.tile(np.repeat(np.arange(nbseg), nbseg**(depth-1-i)), nbseg**i)
        transformMap = [depth, nbseg, matInds]

    # Each column in matInds contains the indices referring to the base transform
    # matrices that must be multiplied together to generate the final transform
    # for each segment of the fractal
    matInds = transformMap[2]

    # Collect all matrices needed for generating fractal curve
    mats = baseMats[matInds]

    # Magic-multiply stacks of matrices together
    def matmul(a, b):
        return np.sum(np.transpose(a,(0,2,1))[..., None] * b[..., None, :], axis=-3)
    mats = reduce(matmul, mats)

    # Transform base points through matrix array
    pts = np.empty((nseg * nbseg + 1, 2))
    for l in range(len(trs)):
        bp = basePts[l]
        pts[l:-1:len(trs)] = np.dot(mats, bp)[:, :2]

    # Finish the curve with the last base point
    pts[-1] = basePts[-1][:2]

    # update fractal curve with new points
    fc.setData(pts[:,0], pts[:,1])


# Update the fractal whenever the base shape or depth has changed
baseLine.sigRegionChanged.connect(update)
depthSpin.valueChanged.connect(update)

# Initialize
update()

if __name__ == '__main__':
    pg.exec()
コメント