Colors
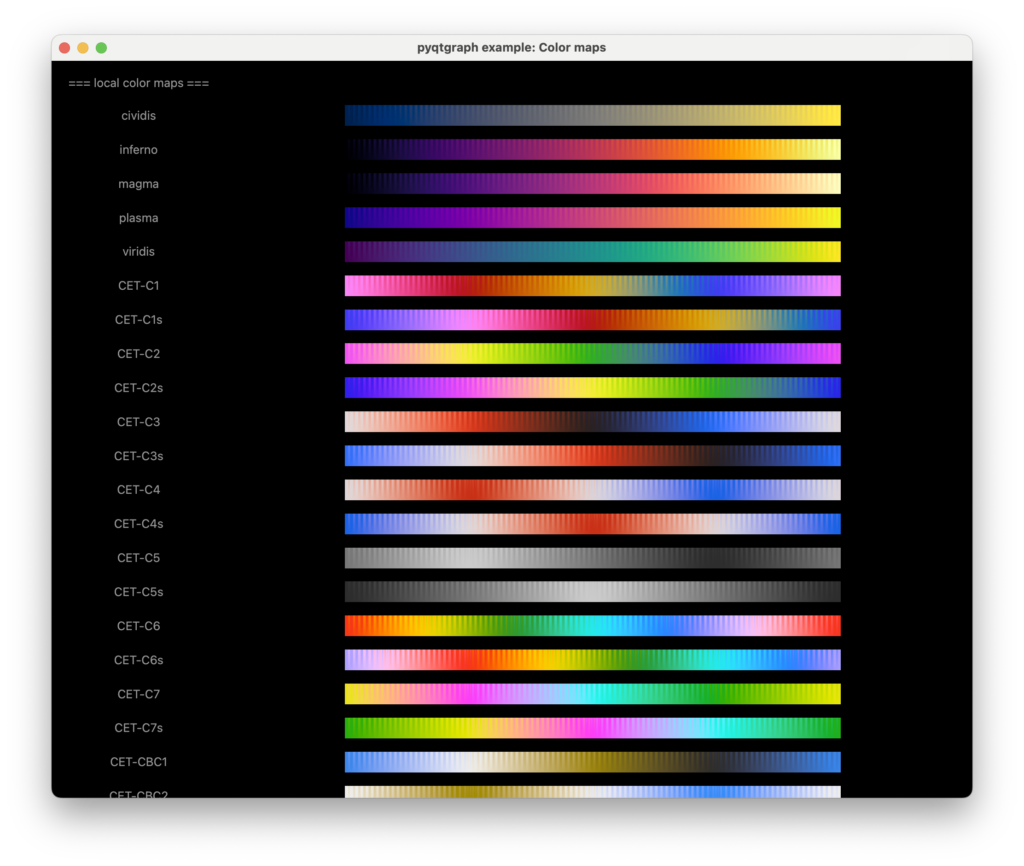
Color Maps

"""
This example displays all color maps currently available, either as local data
or imported from Matplotlib of ColorCET.
"""

import pyqtgraph as pg
from pyqtgraph.Qt import QtCore, QtWidgets

app = pg.mkQApp()

win = QtWidgets.QMainWindow()
win.resize(1000,800)

lw = pg.GraphicsLayoutWidget()
lw.setFixedWidth(1000)
lw.setSizePolicy(QtWidgets.QSizePolicy.Policy.Expanding, QtWidgets.QSizePolicy.Policy.Expanding)

scr = QtWidgets.QScrollArea()
scr.setVerticalScrollBarPolicy(QtCore.Qt.ScrollBarPolicy.ScrollBarAlwaysOn)
scr.setWidget(lw)
win.setCentralWidget(scr)
win.setWindowTitle('pyqtgraph example: Color maps')
win.show()

bar_width = 32
bar_data = pg.colormap.modulatedBarData(width=bar_width)

num_bars = 0

def add_heading(lw, name):
    global num_bars
    lw.addLabel('=== '+name+' ===')
    num_bars += 1
    lw.nextRow()

def add_bar(lw, name, cm):
    global num_bars
    lw.addLabel(name)
    imi = pg.ImageItem( bar_data )
    imi.setLookupTable( cm.getLookupTable(alpha=True) )
    vb = lw.addViewBox(lockAspect=True, enableMouse=False)
    vb.addItem( imi )
    num_bars += 1
    lw.nextRow()

add_heading(lw, 'local color maps')
list_of_maps = pg.colormap.listMaps()
list_of_maps = sorted( list_of_maps, key=lambda x: x.swapcase() )
for map_name in list_of_maps:
    cm = pg.colormap.get(map_name)
    add_bar(lw, map_name, cm)

add_heading(lw, 'Matplotlib import')
list_of_maps = pg.colormap.listMaps('matplotlib')
list_of_maps = sorted( list_of_maps, key=lambda x: x.lower() )
for map_name in list_of_maps:
    cm = pg.colormap.get(map_name, source='matplotlib', skipCache=True)
    if cm is not None:
        add_bar(lw, map_name, cm)

add_heading(lw, 'ColorCET import')
list_of_maps = pg.colormap.listMaps('colorcet')
list_of_maps = sorted( list_of_maps, key=lambda x: x.lower() )
for map_name in list_of_maps:
    cm = pg.colormap.get(map_name, source='colorcet', skipCache=True)
    if cm is not None:
        add_bar(lw, map_name, cm)

lw.setFixedHeight(num_bars * (bar_width+5) )

if __name__ == '__main__':
    pg.exec()
Color Map Linearization
"""
This example demonstrates linearized ColorMap objects using colormap.makeMonochrome()
or using the `ColorMap`'s `linearize()` method.
"""

import numpy as np

import pyqtgraph as pg
from pyqtgraph.Qt import QtCore, QtGui, QtWidgets

name_list = (
    'warm','neutral','cool',
    'green','amber','blue','red','pink','lavender',
    (0.5, 0.2, 0.1, 0.8)
)
ramp_list = [
    pg.colormap.makeMonochrome(name)
    for name in name_list
]

cm_list = []
# Create a gray ramp for demonstrating the idea:
cm = pg.ColorMap( None, [
    QtGui.QColor(  0,   0,   0),
    QtGui.QColor( 10,  10,  10),
    QtGui.QColor(127, 127, 127),
    QtGui.QColor(240, 240, 240),
    QtGui.QColor(255, 255, 255)
])
cm_list.append(('Distorted gray ramp',cm))

# Create a rainbow scale in HSL color space:
length = 41
col_list = []
for idx in range(length):
    frac = idx/(length-1)
    qcol = QtGui.QColor()
    qcol.setHslF( (2*frac-0.15)%1.0, 0.8, 0.5-0.5*np.cos(np.pi*frac) )
    col_list.append(qcol)
cm = pg.ColorMap( None, col_list )
cm_list.append( ('Distorted HSL spiral', cm) )

# Create some random examples:
for example_idx in range(3):
    previous = None
    col_list = []
    for idx in range(8):
        values = np.random.random((3))
        if previous is not None:
            intermediate = (values + previous) / 2
            qcol = QtGui.QColor()
            qcol.setRgbF( *intermediate )
            col_list.append( qcol)
        qcol1 = QtGui.QColor()
        qcol1.setRgbF( *values )
        col_list.append( qcol1)
        previous = values
    cm = pg.ColorMap( None, col_list )
    cm_list.append( (f'random {example_idx+1}', cm) )

app = pg.mkQApp()
win = QtWidgets.QMainWindow()
win.resize(1000,800)

lw = pg.GraphicsLayoutWidget()
lw.setFixedWidth(1000)
lw.setSizePolicy(QtWidgets.QSizePolicy.Policy.Expanding, QtWidgets.QSizePolicy.Policy.Expanding)

scr = QtWidgets.QScrollArea()
scr.setVerticalScrollBarPolicy(QtCore.Qt.ScrollBarPolicy.ScrollBarAlwaysOn)
scr.setWidget(lw)
win.setCentralWidget(scr)
win.setWindowTitle('pyqtgraph example: Linearized color maps')
win.show()

bar_width = 32
bar_data = pg.colormap.modulatedBarData(width=bar_width)

num_bars = 0

def add_heading(lw, name):
    global num_bars
    lw.addLabel('=== '+name+' ===')
    num_bars += 1
    lw.nextRow()

def add_bar(lw, name, cm):
    global num_bars
    lw.addLabel(name)
    imi = pg.ImageItem( bar_data )
    imi.setLookupTable( cm.getLookupTable(alpha=True) )
    vb = lw.addViewBox(lockAspect=True, enableMouse=False)
    vb.addItem( imi )
    num_bars += 1
    lw.nextRow()

add_heading(lw, 'ramp generator')
for cm in ramp_list:
    add_bar(lw, cm.name, cm)

add_heading(lw, 'linearizer demonstration')
for (name, cm) in cm_list:
    add_bar(lw, name, cm)
    cm.linearize()
    add_bar(lw, '> linearized', cm)

add_heading(lw, 'consistency with included maps')
for name in ('CET-C3', 'CET-L17', 'CET-L2'):
    # lw.addLabel(str(name))
    cm = pg.colormap.get(name)
    add_bar(lw, name, cm)
    cm.linearize()
    add_bar(lw, '> linearized', cm)

lw.setFixedHeight(num_bars * (bar_width+5) )

if __name__ == '__main__':
    pg.exec()
Color Gradient Plots

"""
This example demonstrates plotting with color gradients.
It also shows multiple plots with timed rolling updates
"""

import time

import numpy as np

import pyqtgraph as pg
from pyqtgraph.Qt import QtCore, mkQApp


class DataSource(object):
    """ source of buffered demonstration data """
    def __init__(self, sample_rate=200., signal_period=0.55, negative_period=None, max_length=300):
        """ prepare, but don't start yet """
        self.rate = sample_rate
        self.period = signal_period
        self.neg_period = negative_period
        self.start_time = 0.
        self.sample_idx = 0 # number of next sample to be taken

    def start(self, timestamp):
        """ start acquiring simulated data """
        self.start_time = timestamp
        self.sample_idx = 0

    def get_data(self, timestamp, max_length=6000):
        """ return all data acquired since last get_data call """
        next_idx = int( (timestamp - self.start_time) * self.rate )
        if next_idx - self.sample_idx > max_length:
            self.sample_idx = next_idx - max_length # catch up if needed
        # create some mildly intersting data:
        sample_phases = np.arange( self.sample_idx, next_idx, dtype=np.float64 )
        self.sample_idx = next_idx

        sample_phase_pos = sample_phases / (self.period*self.rate)
        sample_phase_pos %= 1.0
        if self.neg_period is None:
            return sample_phase_pos**4
        sample_phase_neg = sample_phases / (self.neg_period*self.rate)
        sample_phase_neg %= 1.0
        return sample_phase_pos**4 - sample_phase_neg**4

class MainWindow(pg.GraphicsLayoutWidget):
    """ example application main window """
    def __init__(self):
        super().__init__()
        self.setWindowTitle('pyqtgraph example: gradient plots')
        self.resize(800,800)
        self.show()

        layout = self # we are using a GraphicsLayoutWidget as main window for convenience
        cm = pg.colormap.get('CET-L17')
        cm.reverse()
        pen0 = cm.getPen( span=(0.0,1.0), width=5 )
        curve0 = pg.PlotDataItem(pen=pen0 )
        comment0 = 'Clipped color map applied to vertical axis'

        cm = pg.colormap.get('CET-D1')
        cm.setMappingMode('diverging')
        brush = cm.getBrush( span=(-1., 1.), orientation='vertical' )
        curve1 = pg.PlotDataItem(pen='w', brush=brush, fillLevel=0.0 )
        comment1 = 'Diverging vertical color map used as brush'

        cm = pg.colormap.get('CET-L17')
        cm.setMappingMode('mirror')
        pen2 = cm.getPen( span=(400.0,600.0), width=5, orientation='horizontal' )
        curve2 = pg.PlotDataItem(pen=pen2 )
        comment2 = 'Mirrored color map applied to horizontal axis'

        cm = pg.colormap.get('CET-C2')
        cm.setMappingMode('repeat')
        pen3 = cm.getPen( span=(100, 200), width=5, orientation='horizontal' )
        curve3 = pg.PlotDataItem(pen=pen3 ) # vertical diverging fill
        comment3 = 'Repeated color map applied to horizontal axis'

        curves = (curve0, curve1, curve2, curve3)
        comments = (comment0, comment1, comment2, comment3)

        length = int( 3.0 * 200. ) # length of display in samples
        self.top_plot = None
        for idx, (curve, comment) in enumerate( zip(curves,comments) ):
            plot = layout.addPlot(row=idx+1, col=0)
            text = pg.TextItem( comment, anchor=(0,1) )
            text.setPos(0.,1.)
            if self.top_plot is None:
                self.top_plot = plot
            else:
                plot.setXLink( self.top_plot )
            plot.addItem( curve )
            plot.addItem( text )
            plot.setXRange( 0, length )
            if idx != 1: plot.setYRange(  0. , 1.1 )
            else       : plot.setYRange( -1. , 1.2 ) # last plot include positive/negative data

        self.traces = (
            {'crv': curve0, 'buf': np.zeros( length ), 'ptr':0, 'ds': DataSource( signal_period=0.55 ) },
            {'crv': curve1, 'buf': np.zeros( length ), 'ptr':0, 'ds': DataSource( signal_period=0.61, negative_period=0.55 ) },
            {'crv': curve2, 'buf': np.zeros( length ), 'ptr':0, 'ds': DataSource( signal_period=0.65 ) },
            {'crv': curve3, 'buf': np.zeros( length ), 'ptr':0, 'ds': DataSource( signal_period=0.52 ) },
        )
        self.timer = QtCore.QTimer(timerType=QtCore.Qt.TimerType.PreciseTimer)
        self.timer.timeout.connect(self.update)
        timestamp = time.perf_counter()
        for dic in self.traces:
            dic['ds'].start( timestamp )
        self.last_update = time.perf_counter()
        self.mean_dt = None
        self.timer.start(33)

    def update(self):
        """ called by timer at 30 Hz """
        timestamp = time.perf_counter()
        # measure actual update rate:
        dt = timestamp - self.last_update
        if self.mean_dt is None:
            self.mean_dt = dt
        else:
            self.mean_dt = 0.95 * self.mean_dt + 0.05 * dt # average over fluctuating measurements
        self.top_plot.setTitle(
            'refresh: {:0.1f}ms -> {:0.1f} fps'.format( 1000*self.mean_dt, 1/self.mean_dt )
        )
        # handle rolling buffer:
        self.last_update = timestamp
        for dic in self.traces:
            new_data = dic['ds'].get_data( timestamp )
            idx_a = dic['ptr']
            idx_b = idx_a + len( new_data )
            len_buffer = dic['buf'].shape[0]
            if idx_b < len_buffer: # data does not cross buffer boundary
                dic['buf'][idx_a:idx_b] = new_data
            else: # part of the new data needs to roll over to beginning of buffer
                len_1 = len_buffer - idx_a # this many elements still fit
                dic['buf'][idx_a:idx_a+len_1] = new_data[:len_1] # first part of data at end
                idx_b = len(new_data) - len_1
                dic['buf'][0:idx_b] = new_data[len_1:] # second part of data at re-start
            dic['ptr'] = idx_b
            dic['crv'].setData( dic['buf'] )

mkQApp("Gradient plotting example")
main_window = MainWindow()

## Start Qt event loop
if __name__ == '__main__':
    pg.exec()


コメント