"""
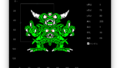
Demonstrates a variety of uses for ROI. This class provides a user-adjustable
region of interest marker. It is possible to customize the layout and
function of the scale/rotate handles in very flexible ways.
"""
import numpy as np
import pyqtgraph as pg
pg.setConfigOptions(imageAxisOrder='row-major')
## Create image to display
arr = np.ones((100, 100), dtype=float)
arr[45:55, 45:55] = 0
arr[25, :] = 5
arr[:, 25] = 5
arr[75, :] = 5
arr[:, 75] = 5
arr[50, :] = 10
arr[:, 50] = 10
arr += np.sin(np.linspace(0, 20, 100)).reshape(1, 100)
arr += np.random.normal(size=(100,100))
# add an arrow for asymmetry
arr[10, :50] = 10
arr[9:12, 44:48] = 10
arr[8:13, 44:46] = 10
## create GUI
app = pg.mkQApp("ROI Examples")
w = pg.GraphicsLayoutWidget(show=True, size=(1000,800), border=True)
w.setWindowTitle('pyqtgraph example: ROI Examples')
text = """Data Selection From Image.<br>\n
Drag an ROI or its handles to update the selected image.<br>
Hold CTRL while dragging to snap to pixel boundaries<br>
and 15-degree rotation angles.
"""
w1 = w.addLayout(row=0, col=0)
label1 = w1.addLabel(text, row=0, col=0)
v1a = w1.addViewBox(row=1, col=0, lockAspect=True)
v1b = w1.addViewBox(row=2, col=0, lockAspect=True)
img1a = pg.ImageItem(arr)
v1a.addItem(img1a)
img1b = pg.ImageItem()
v1b.addItem(img1b)
v1a.disableAutoRange('xy')
v1b.disableAutoRange('xy')
v1a.autoRange()
v1b.autoRange()
rois = []
rois.append(pg.RectROI([20, 20], [20, 20], pen=(0,9)))
rois[-1].addRotateHandle([1,0], [0.5, 0.5])
rois.append(pg.LineROI([0, 60], [20, 80], width=5, pen=(1,9)))
rois.append(pg.TriangleROI([80, 75], 20, pen=(5, 9)))
rois.append(pg.MultiRectROI([[20, 90], [50, 60], [60, 90]], width=5, pen=(2,9)))
rois.append(pg.EllipseROI([60, 10], [30, 20], pen=(3,9)))
rois.append(pg.CircleROI([80, 50], [20, 20], pen=(4,9)))
#rois.append(pg.LineSegmentROI([[110, 50], [20, 20]], pen=(5,9)))
rois.append(pg.PolyLineROI([[80, 60], [90, 30], [60, 40]], pen=(6,9), closed=True))
def update(roi):
img1b.setImage(roi.getArrayRegion(arr, img1a), levels=(0, arr.max()))
v1b.autoRange()
for roi in rois:
roi.sigRegionChanged.connect(update)
v1a.addItem(roi)
update(rois[-1])
text = """User-Modifiable ROIs<br>
Click on a line segment to add a new handle.
Right click on a handle to remove.
"""
w2 = w.addLayout(row=0, col=1)
label2 = w2.addLabel(text, row=0, col=0)
v2a = w2.addViewBox(row=1, col=0, lockAspect=True)
r2a = pg.PolyLineROI([[0,0], [10,10], [10,30], [30,10]], closed=True)
v2a.addItem(r2a)
r2b = pg.PolyLineROI([[0,-20], [10,-10], [10,-30]], closed=False)
v2a.addItem(r2b)
v2a.disableAutoRange('xy')
#v2b.disableAutoRange('xy')
v2a.autoRange()
#v2b.autoRange()
text = """Building custom ROI types<Br>
ROIs can be built with a variety of different handle types<br>
that scale and rotate the roi around an arbitrary center location
"""
w3 = w.addLayout(row=1, col=0)
label3 = w3.addLabel(text, row=0, col=0)
v3 = w3.addViewBox(row=1, col=0, lockAspect=True)
r3a = pg.ROI([0,0], [10,10])
v3.addItem(r3a)
## handles scaling horizontally around center
r3a.addScaleHandle([1, 0.5], [0.5, 0.5])
r3a.addScaleHandle([0, 0.5], [0.5, 0.5])
## handles scaling vertically from opposite edge
r3a.addScaleHandle([0.5, 0], [0.5, 1])
r3a.addScaleHandle([0.5, 1], [0.5, 0])
## handles scaling both vertically and horizontally
r3a.addScaleHandle([1, 1], [0, 0])
r3a.addScaleHandle([0, 0], [1, 1])
r3b = pg.ROI([20,0], [10,10])
v3.addItem(r3b)
## handles rotating around center
r3b.addRotateHandle([1, 1], [0.5, 0.5])
r3b.addRotateHandle([0, 0], [0.5, 0.5])
## handles rotating around opposite corner
r3b.addRotateHandle([1, 0], [0, 1])
r3b.addRotateHandle([0, 1], [1, 0])
## handles rotating/scaling around center
r3b.addScaleRotateHandle([0, 0.5], [0.5, 0.5])
# handles rotating/scaling around arbitrary point
r3b.addScaleRotateHandle([0.3, 0], [0.9, 0.7])
v3.disableAutoRange('xy')
v3.autoRange()
text = """Transforming objects with ROI"""
w4 = w.addLayout(row=1, col=1)
label4 = w4.addLabel(text, row=0, col=0)
v4 = w4.addViewBox(row=1, col=0, lockAspect=True)
g = pg.GridItem()
v4.addItem(g)
r4 = pg.ROI([0,0], [100,100], resizable=False, removable=True)
r4.addRotateHandle([1,0], [0.5, 0.5])
r4.addRotateHandle([0,1], [0.5, 0.5])
img4 = pg.ImageItem(arr)
v4.addItem(r4)
img4.setParentItem(r4)
v4.disableAutoRange('xy')
v4.autoRange()
# Provide a callback to remove the ROI (and its children) when
# "remove" is selected from the context menu.
def remove():
v4.removeItem(r4)
r4.sigRemoveRequested.connect(remove)
if __name__ == '__main__':
pg.exec()
Bar Graph
"""
Simple example using BarGraphItem
"""

import numpy as np

import pyqtgraph as pg

win = pg.plot()
win.setWindowTitle('pyqtgraph example: BarGraphItem')

x = np.arange(10)
y1 = np.sin(x)
y2 = 1.1 * np.sin(x+1)
y3 = 1.2 * np.sin(x+2)

bg1 = pg.BarGraphItem(x=x, height=y1, width=0.3, brush='r')
bg2 = pg.BarGraphItem(x=x+0.33, height=y2, width=0.3, brush='g')
bg3 = pg.BarGraphItem(x=x+0.66, height=y3, width=0.3, brush='b')

win.addItem(bg1)
win.addItem(bg2)
win.addItem(bg3)


# Final example shows how to handle mouse clicks:
class BarGraph(pg.BarGraphItem):
    def mouseClickEvent(self, event):
        print("clicked")


bg = BarGraph(x=x, y=y1*0.3+2, height=0.4+y1*0.2, width=0.8)
win.addItem(bg)

if __name__ == '__main__':
    pg.exec()
GraphicsLayout
"""
Demonstrate the use of layouts to control placement of multiple plots / views /
labels
"""


import numpy as np

import pyqtgraph as pg

app = pg.mkQApp("Gradiant Layout Example")
view = pg.GraphicsView()
l = pg.GraphicsLayout(border=(100,100,100))
view.setCentralItem(l)
view.show()
view.setWindowTitle('pyqtgraph example: GraphicsLayout')
view.resize(800,600)

## Title at top
text = """
This example demonstrates the use of GraphicsLayout to arrange items in a grid.<br>
The items added to the layout must be subclasses of QGraphicsWidget (this includes <br>
PlotItem, ViewBox, LabelItem, and GrphicsLayout itself).
"""
l.addLabel(text, col=1, colspan=4)
l.nextRow()

## Put vertical label on left side
l.addLabel('Long Vertical Label', angle=-90, rowspan=3)

## Add 3 plots into the first row (automatic position)
p1 = l.addPlot(title="Plot 1")
p2 = l.addPlot(title="Plot 2")
vb = l.addViewBox(lockAspect=True)
img = pg.ImageItem(np.random.normal(size=(100,100)))
vb.addItem(img)
vb.autoRange()


## Add a sub-layout into the second row (automatic position)
## The added item should avoid the first column, which is already filled
l.nextRow()
l2 = l.addLayout(colspan=3, border=(50,0,0))
l2.setContentsMargins(10, 10, 10, 10)
l2.addLabel("Sub-layout: this layout demonstrates the use of shared axes and axis labels", colspan=3)
l2.nextRow()
l2.addLabel('Vertical Axis Label', angle=-90, rowspan=2)
p21 = l2.addPlot()
p22 = l2.addPlot()
l2.nextRow()
p23 = l2.addPlot()
p24 = l2.addPlot()
l2.nextRow()
l2.addLabel("HorizontalAxisLabel", col=1, colspan=2)

## hide axes on some plots
p21.hideAxis('bottom')
p22.hideAxis('bottom')
p22.hideAxis('left')
p24.hideAxis('left')
p21.hideButtons()
p22.hideButtons()
p23.hideButtons()
p24.hideButtons()


## Add 2 more plots into the third row (manual position)
p4 = l.addPlot(row=3, col=1)
p5 = l.addPlot(row=3, col=2, colspan=2)

## show some content in the plots
p1.plot([1,3,2,4,3,5])
p2.plot([1,3,2,4,3,5])
p4.plot([1,3,2,4,3,5])
p5.plot([1,3,2,4,3,5])

if __name__ == '__main__':
    pg.exec()
LegendItem
"""
Demonstrates basic use of LegendItem
"""

import numpy as np

import pyqtgraph as pg

win = pg.plot()
win.setWindowTitle('pyqtgraph example: BarGraphItem')

# # option1: only for .plot(), following c1,c2 for example-----------------------
# win.addLegend(frame=False, colCount=2)

# bar graph
x = np.arange(10)
y = np.sin(x+2) * 3
bg1 = pg.BarGraphItem(x=x, height=y, width=0.3, brush='b', pen='w', name='bar')
win.addItem(bg1)

# curve
c1 = win.plot([np.random.randint(0,8) for i in range(10)], pen='r', symbol='t', symbolPen='r', symbolBrush='g', name='curve1')
c2 = win.plot([2,1,4,3,1,3,2,4,3,2], pen='g', fillLevel=0, fillBrush=(255,255,255,30), name='curve2')

# scatter plot
s1 = pg.ScatterPlotItem(size=10, pen=pg.mkPen(None), brush=pg.mkBrush(255, 255, 255, 120), name='scatter')
spots = [{'pos': [i, np.random.randint(-3, 3)], 'data': 1} for i in range(10)]
s1.addPoints(spots)
win.addItem(s1)

# # option2: generic method------------------------------------------------
legend = pg.LegendItem((80,60), offset=(70,20))
legend.setParentItem(win.graphicsItem())
legend.addItem(bg1, 'bar')
legend.addItem(c1, 'curve1')
legend.addItem(c2, 'curve2')
legend.addItem(s1, 'scatter')

if __name__ == '__main__':
    pg.exec()
Text Item
"""
This example shows how to insert text into a scene using TextItem. This class
is for displaying text that is anchored to a particular location in the data
coordinate system, but which is always displayed unscaled.

For text that scales with the data, use QTextItem.
For text that can be placed in a layout, use LabelItem.
"""

import numpy as np

import pyqtgraph as pg
from pyqtgraph.Qt import QtCore

x = np.linspace(-20, 20, 1000)
y = np.sin(x) / x
plot = pg.plot()   ## create an empty plot widget
plot.setYRange(-1, 2)
plot.setWindowTitle('pyqtgraph example: text')
curve = plot.plot(x,y)  ## add a single curve

## Create text object, use HTML tags to specify color/size
text = pg.TextItem(html='<div style="text-align: center"><span style="color: #FFF;">This is the</span><br><span style="color: #FF0; font-size: 16pt;">PEAK</span></div>', anchor=(-0.3,0.5), angle=45, border='w', fill=(0, 0, 255, 100))
plot.addItem(text)
text.setPos(0, y.max())

## Draw an arrowhead next to the text box
arrow = pg.ArrowItem(pos=(0, y.max()), angle=-45)
plot.addItem(arrow)


## Set up an animated arrow and text that track the curve
curvePoint = pg.CurvePoint(curve)
plot.addItem(curvePoint)
text2 = pg.TextItem("test", anchor=(0.5, -1.0))
text2.setParentItem(curvePoint)
arrow2 = pg.ArrowItem(angle=90)
arrow2.setParentItem(curvePoint)

## update position every 10ms
index = 0
def update():
    global curvePoint, index
    index = (index + 1) % len(x)
    curvePoint.setPos(float(index)/(len(x)-1))
    text2.setText('[%0.1f, %0.1f]' % (x[index], y[index]))

timer = QtCore.QTimer()
timer.timeout.connect(update)
timer.start(10)

if __name__ == '__main__':
    pg.exec()
Linked Views
"""
This example demonstrates the ability to link the axes of views together
Views can be linked manually using the context menu, but only if they are given
names.
"""

import numpy as np

import pyqtgraph as pg

app = pg.mkQApp("Linked Views Example")
#mw = QtWidgets.QMainWindow()
#mw.resize(800,800)

x = np.linspace(-50, 50, 1000)
y = np.sin(x) / x

win = pg.GraphicsLayoutWidget(show=True, title="pyqtgraph example: Linked Views")
win.resize(800,600)

win.addLabel("Linked Views", colspan=2)
win.nextRow()

p1 = win.addPlot(x=x, y=y, name="Plot1", title="Plot1")
p2 = win.addPlot(x=x, y=y, name="Plot2", title="Plot2: Y linked with Plot1")
p2.setLabel('bottom', "Label to test offset")
p2.setYLink('Plot1')  ## test linking by name


## create plots 3 and 4 out of order
p4 = win.addPlot(x=x, y=y, name="Plot4", title="Plot4: X -> Plot3 (deferred), Y -> Plot1", row=2, col=1)
p4.setXLink('Plot3')  ## Plot3 has not been created yet, but this should still work anyway.
p4.setYLink(p1)
p3 = win.addPlot(x=x, y=y, name="Plot3", title="Plot3: X linked with Plot1", row=2, col=0)
p3.setXLink(p1)
p3.setLabel('left', "Label to test offset")
#QtWidgets.QApplication.processEvents()

if __name__ == '__main__':
    pg.exec()
Arrow
"""
Display an animated arrowhead following a curve.
This example uses the CurveArrow class, which is a combination
of ArrowItem and CurvePoint.

To place a static arrow anywhere in a scene, use ArrowItem.
To attach other types of item to a curve, use CurvePoint.
"""

import numpy as np

import pyqtgraph as pg
from pyqtgraph.Qt import QtCore, QtWidgets

app = pg.mkQApp("Arrow Example")

w = QtWidgets.QMainWindow()
cw = pg.GraphicsLayoutWidget()
w.show()
w.resize(400,600)
w.setCentralWidget(cw)
w.setWindowTitle('pyqtgraph example: Arrow')

p = cw.addPlot(row=0, col=0)
p2 = cw.addPlot(row=1, col=0)

## variety of arrow shapes
a1 = pg.ArrowItem(angle=-160, tipAngle=60, headLen=40, tailLen=40, tailWidth=20, pen={'color': 'w', 'width': 3})
a2 = pg.ArrowItem(angle=-120, tipAngle=30, baseAngle=20, headLen=40, tailLen=40, tailWidth=8, pen=None, brush='y')
a3 = pg.ArrowItem(angle=-60, baseAngle=20, headLen=40, headWidth=20, tailLen=None, brush=None)
a4 = pg.ArrowItem(angle=-20, tipAngle=30, baseAngle=-30, headLen=40, tailLen=None)
a2.setPos(10,0)
a3.setPos(20,0)
a4.setPos(30,0)
p.addItem(a1)
p.addItem(a2)
p.addItem(a3)
p.addItem(a4)
p.setRange(QtCore.QRectF(-20, -10, 60, 20))


## Animated arrow following curve
c = p2.plot(x=np.sin(np.linspace(0, 2*np.pi, 1000)), y=np.cos(np.linspace(0, 6*np.pi, 1000)))
a = pg.CurveArrow(c)
a.setStyle(headLen=40)
p2.addItem(a)
anim = a.makeAnimation(loop=-1)
anim.start()

if __name__ == '__main__':
    pg.exec()
ViewBox
"""
ViewBox is the general-purpose graphical container that allows the user to
zoom / pan to inspect any area of a 2D coordinate system.

This example demonstrates many of the features ViewBox provides.
"""

import numpy as np

import pyqtgraph as pg

x = np.arange(1000, dtype=float)
y = np.random.normal(size=1000)
y += 5 * np.sin(x/100)

win = pg.GraphicsLayoutWidget(show=True)
win.setWindowTitle('pyqtgraph example: ____')
win.resize(1000, 800)
win.ci.setBorder((50, 50, 100))

sub1 = win.addLayout()
sub1.addLabel("<b>Standard mouse interaction:</b><br>left-drag to pan, right-drag to zoom.")
sub1.nextRow()
v1 = sub1.addViewBox()
l1 = pg.PlotDataItem(y)
v1.addItem(l1)


sub2 = win.addLayout()
sub2.addLabel("<b>One-button mouse interaction:</b><br>left-drag zoom to box, wheel to zoom out.")
sub2.nextRow()
v2 = sub2.addViewBox()
v2.setMouseMode(v2.RectMode)
l2 = pg.PlotDataItem(y)
v2.addItem(l2)

win.nextRow()

sub3 = win.addLayout()
sub3.addLabel("<b>Locked aspect ratio when zooming.</b>")
sub3.nextRow()
v3 = sub3.addViewBox()
v3.setAspectLocked(1.0)
l3 = pg.PlotDataItem(y)
v3.addItem(l3)

sub4 = win.addLayout()
sub4.addLabel("<b>View limits:</b><br>prevent panning or zooming past limits.")
sub4.nextRow()
v4 = sub4.addViewBox()
v4.setLimits(xMin=-100, xMax=1100,
             minXRange=20, maxXRange=500,
             yMin=-10, yMax=10,
             minYRange=1, maxYRange=10)
l4 = pg.PlotDataItem(y)
v4.addItem(l4)

win.nextRow()

sub5 = win.addLayout()
sub5.addLabel("<b>Linked axes:</b> Data in this plot is always X-aligned to<br>the plot above.")
sub5.nextRow()
v5 = sub5.addViewBox()
v5.setXLink(v3)
l5 = pg.PlotDataItem(y)
v5.addItem(l5)

sub6 = win.addLayout()
sub6.addLabel("<b>Disable mouse:</b> Per-axis control over mouse input.<br>"
              "<b>Auto-scale-visible:</b> Automatically fit *visible* data within view<br>"
              "(try panning left-right).")
sub6.nextRow()
v6 = sub6.addViewBox()
v6.setMouseEnabled(x=True, y=False)
v6.enableAutoRange(x=False, y=True)
v6.setXRange(300, 450)
v6.setAutoVisible(x=False, y=True)
l6 = pg.PlotDataItem(y)
v6.addItem(l6)

if __name__ == '__main__':
    pg.exec()
Custom Graphics
"""
Demonstrate creation of a custom graphic (a candlestick plot)

"""

import pyqtgraph as pg
from pyqtgraph import QtCore, QtGui


## Create a subclass of GraphicsObject.
## The only required methods are paint() and boundingRect()
## (see QGraphicsItem documentation)
class CandlestickItem(pg.GraphicsObject):
    def __init__(self, data):
        pg.GraphicsObject.__init__(self)
        self.data = data  ## data must have fields: time, open, close, min, max
        self.generatePicture()

    def generatePicture(self):
        ## pre-computing a QPicture object allows paint() to run much more quickly,
        ## rather than re-drawing the shapes every time.
        self.picture = QtGui.QPicture()
        p = QtGui.QPainter(self.picture)
        p.setPen(pg.mkPen('w'))
        w = (self.data[1][0] - self.data[0][0]) / 3.
        for (t, open, close, min, max) in self.data:
            p.drawLine(QtCore.QPointF(t, min), QtCore.QPointF(t, max))
            if open > close:
                p.setBrush(pg.mkBrush('r'))
            else:
                p.setBrush(pg.mkBrush('g'))
            p.drawRect(QtCore.QRectF(t-w, open, w*2, close-open))
        p.end()

    def paint(self, p, *args):
        p.drawPicture(0, 0, self.picture)

    def boundingRect(self):
        ## boundingRect _must_ indicate the entire area that will be drawn on
        ## or else we will get artifacts and possibly crashing.
        ## (in this case, QPicture does all the work of computing the bouning rect for us)
        return QtCore.QRectF(self.picture.boundingRect())

data = [  ## fields are (time, open, close, min, max).
    (1., 10, 13, 5, 15),
    (2., 13, 17, 9, 20),
    (3., 17, 14, 11, 23),
    (4., 14, 15, 5, 19),
    (5., 15, 9, 8, 22),
    (6., 9, 15, 8, 16),
]
item = CandlestickItem(data)
plt = pg.plot()
plt.addItem(item)
plt.setWindowTitle('pyqtgraph example: customGraphicsItem')

if __name__ == '__main__':
    pg.exec()
Labeled Graph
"""
Simple example of subclassing GraphItem.
"""

import numpy as np

import pyqtgraph as pg
from pyqtgraph.Qt import QtCore

# Enable antialiasing for prettier plots
pg.setConfigOptions(antialias=True)

w = pg.GraphicsLayoutWidget(show=True)
w.setWindowTitle('pyqtgraph example: CustomGraphItem')
v = w.addViewBox()
v.setAspectLocked()

class Graph(pg.GraphItem):
    def __init__(self):
        self.dragPoint = None
        self.dragOffset = None
        self.textItems = []
        pg.GraphItem.__init__(self)
        self.scatter.sigClicked.connect(self.clicked)

    def setData(self, **kwds):
        self.text = kwds.pop('text', [])
        self.data = kwds
        if 'pos' in self.data:
            npts = self.data['pos'].shape[0]
            self.data['data'] = np.empty(npts, dtype=[('index', int)])
            self.data['data']['index'] = np.arange(npts)
        self.setTexts(self.text)
        self.updateGraph()

    def setTexts(self, text):
        for i in self.textItems:
            i.scene().removeItem(i)
        self.textItems = []
        for t in text:
            item = pg.TextItem(t)
            self.textItems.append(item)
            item.setParentItem(self)

    def updateGraph(self):
        pg.GraphItem.setData(self, **self.data)
        for i,item in enumerate(self.textItems):
            item.setPos(*self.data['pos'][i])


    def mouseDragEvent(self, ev):
        if ev.button() != QtCore.Qt.MouseButton.LeftButton:
            ev.ignore()
            return

        if ev.isStart():
            # We are already one step into the drag.
            # Find the point(s) at the mouse cursor when the button was first
            # pressed:
            pos = ev.buttonDownPos()
            pts = self.scatter.pointsAt(pos)
            if len(pts) == 0:
                ev.ignore()
                return
            self.dragPoint = pts[0]
            ind = pts[0].data()[0]
            self.dragOffset = self.data['pos'][ind] - pos
        elif ev.isFinish():
            self.dragPoint = None
            return
        else:
            if self.dragPoint is None:
                ev.ignore()
                return

        ind = self.dragPoint.data()[0]
        self.data['pos'][ind] = ev.pos() + self.dragOffset
        self.updateGraph()
        ev.accept()

    def clicked(self, pts):
        print("clicked: %s" % pts)


g = Graph()
v.addItem(g)

## Define positions of nodes
pos = np.array([
    [0,0],
    [10,0],
    [0,10],
    [10,10],
    [5,5],
    [15,5]
    ], dtype=float)

## Define the set of connections in the graph
adj = np.array([
    [0,1],
    [1,3],
    [3,2],
    [2,0],
    [1,5],
    [3,5],
    ])

## Define the symbol to use for each node (this is optional)
symbols = ['o','o','o','o','t','+']

## Define the line style for each connection (this is optional)
lines = np.array([
    (255,0,0,255,1),
    (255,0,255,255,2),
    (255,0,255,255,3),
    (255,255,0,255,2),
    (255,0,0,255,1),
    (255,255,255,255,4),
    ], dtype=[('red',np.ubyte),('green',np.ubyte),('blue',np.ubyte),('alpha',np.ubyte),('width',float)])

## Define text to show next to each symbol
texts = ["Point %d" % i for i in range(6)]

## Update the graph
g.setData(pos=pos, adj=adj, pen=lines, size=1, symbol=symbols, pxMode=False, text=texts)


if __name__ == '__main__':
    pg.exec()
PColorMeshItem
"""
Demonstrates very basic use of PColorMeshItem
"""

import time

import numpy as np

import pyqtgraph as pg
from pyqtgraph.Qt import QtCore

app = pg.mkQApp("PColorMesh Example")

## Create window with GraphicsView widget
win = pg.GraphicsLayoutWidget()
win.show()  ## show widget alone in its own window
win.setWindowTitle('pyqtgraph example: pColorMeshItem')
view = win.addViewBox()


## Create data

# To enhance the non-grid meshing, we randomize the polygon vertices per and
# certain amount
randomness = 5

# x and y being the vertices of the polygons, they share the same shape
# However the shape can be different in both dimension
xn = 50 # nb points along x
yn = 40 # nb points along y


x = np.repeat(np.arange(1, xn+1), yn).reshape(xn, yn)\
    + np.random.random((xn, yn))*randomness
y = np.tile(np.arange(1, yn+1), xn).reshape(xn, yn)\
    + np.random.random((xn, yn))*randomness
x.sort(axis=0)
y.sort(axis=0)


# z being the color of the polygons its shape must be decreased by one in each dimension
z = np.exp(-(x*xn)**2/1000)[:-1,:-1]

## Create image item
edgecolors   = None
antialiasing = False
# edgecolors = {'color':'w', 'width':2} # May be uncommened to see edgecolor effect
# antialiasing = True # May be uncommened to see antialiasing effect
pcmi = pg.PColorMeshItem(edgecolors=edgecolors, antialiasing=antialiasing)
view.addItem(pcmi)
textitem = pg.TextItem(anchor=(1, 0))
view.addItem(textitem)


## Set the animation
fps = 25 # Frame per second of the animation

# Wave parameters
wave_amplitude  = 3
wave_speed      = 0.3
wave_length     = 10
color_speed     = 0.3

timer = QtCore.QTimer()
timer.setSingleShot(True)
# not using QTimer.singleShot() because of persistence on PyQt. see PR #1605

textpos = None
i=0
def updateData():
    global i
    global textpos

    ## Display the new data set
    t0 = time.perf_counter()
    new_x = x
    new_y = y+wave_amplitude*np.cos(x/wave_length+i)
    new_z = np.exp(-(x-np.cos(i*color_speed)*xn)**2/1000)[:-1,:-1]
    t1 = time.perf_counter()
    pcmi.setData(new_x,
                 new_y,
                 new_z)
    t2 = time.perf_counter()

    i += wave_speed

    # display info in top-right corner
    textitem.setText(f'{(t2 - t1)*1000:.1f} ms')
    if textpos is None:
        textpos = pcmi.width(), pcmi.height()
        textitem.setPos(*textpos)

    # cap update rate at fps
    delay = max(1000/fps - (t2 - t0), 0)
    timer.start(int(delay))

timer.timeout.connect(updateData)
updateData()

if __name__ == '__main__':
    pg.exec()


コメント