"""
Demonstrates use of PlotWidget class. This is little more than a
GraphicsView with a PlotItem placed in its center.
"""

import numpy as np

import pyqtgraph as pg
from pyqtgraph.Qt import QtCore, QtWidgets

app = pg.mkQApp()
mw = QtWidgets.QMainWindow()
mw.setWindowTitle('pyqtgraph example: PlotWidget')
mw.resize(800,800)
cw = QtWidgets.QWidget()
mw.setCentralWidget(cw)
l = QtWidgets.QVBoxLayout()
cw.setLayout(l)

pw = pg.PlotWidget(name='Plot1')  ## giving the plots names allows us to link their axes together
l.addWidget(pw)
pw2 = pg.PlotWidget(name='Plot2')
l.addWidget(pw2)
pw3 = pg.PlotWidget()
l.addWidget(pw3)

mw.show()

## Create an empty plot curve to be filled later, set its pen
p1 = pw.plot()
p1.setPen((200,200,100))

## Add in some extra graphics
rect = QtWidgets.QGraphicsRectItem(QtCore.QRectF(0, 0, 1, 5e-11))
rect.setPen(pg.mkPen(100, 200, 100))
pw.addItem(rect)

pw.setLabel('left', 'Value', units='V')
pw.setLabel('bottom', 'Time', units='s')
pw.setXRange(0, 2)
pw.setYRange(0, 1e-10)

def rand(n):
    data = np.random.random(n)
    data[int(n*0.1):int(n*0.13)] += .5
    data[int(n*0.18)] += 2
    data[int(n*0.1):int(n*0.13)] *= 5
    data[int(n*0.18)] *= 20
    data *= 1e-12
    return data, np.arange(n, n+len(data)) / float(n)


def updateData():
    yd, xd = rand(10000)
    p1.setData(y=yd, x=xd)

## Start a timer to rapidly update the plot in pw
t = QtCore.QTimer()
t.timeout.connect(updateData)
t.start(50)
#updateData()

## Multiple parameterized plots--we can autogenerate averages for these.
for i in range(0, 5):
    for j in range(0, 3):
        yd, xd = rand(10000)
        pw2.plot(y=yd*(j+1), x=xd, params={'iter': i, 'val': j})

## Test large numbers
curve = pw3.plot(np.random.normal(size=100)*1e0, clickable=True)
curve.curve.setClickable(True)
curve.setPen('w')  ## white pen
curve.setShadowPen(pg.mkPen((70,70,30), width=6, cosmetic=True))

def clicked():
    print("curve clicked")
curve.sigClicked.connect(clicked)

lr = pg.LinearRegionItem([1, 30], bounds=[0,100], movable=True)
pw3.addItem(lr)
line = pg.InfiniteLine(angle=90, movable=True)
pw3.addItem(line)
line.setBounds([0,200])

if __name__ == '__main__':
    pg.exec()
SpinBox
"""
This example demonstrates the SpinBox widget, which is an extension of
QDoubleSpinBox providing some advanced features:

  * SI-prefixed units
  * Non-linear stepping modes
  * Bounded/unbounded values

"""

import ast

import pyqtgraph as pg
from pyqtgraph.Qt import QtWidgets

app = pg.mkQApp("SpinBox Example")


spins = [
    ("Floating-point spin box, min=0, no maximum.<br>Non-finite values (nan, inf) are permitted.",
     pg.SpinBox(value=5.0, bounds=[0, None], finite=False)),
    ("Integer spin box, dec stepping<br>(1-9, 10-90, 100-900, etc), decimals=4",
     pg.SpinBox(value=10, int=True, dec=True, minStep=1, step=1, decimals=4)),
    ("Float with SI-prefixed units<br>(n, u, m, k, M, etc)",
     pg.SpinBox(value=0.9, suffix='V', siPrefix=True)),
    ("Float with SI-prefixed units,<br>dec step=0.1, minStep=0.1",
     pg.SpinBox(value=1.0, suffix='PSI', siPrefix=True, dec=True, step=0.1, minStep=0.1)),
    ("Float with SI-prefixed units,<br>dec step=0.5, minStep=0.01",
     pg.SpinBox(value=1.0, suffix='V', siPrefix=True, dec=True, step=0.5, minStep=0.01)),
    ("Float with SI-prefixed units,<br>dec step=1.0, minStep=0.001",
     pg.SpinBox(value=1.0, suffix='V', siPrefix=True, dec=True, step=1.0, minStep=0.001)),
    ("Float with SI prefix but no suffix",
     pg.SpinBox(value=1e9, siPrefix=True)),
    ("Float with custom formatting",
     pg.SpinBox(value=23.07, format='${value:0.02f}',
                regex='\$?(?P<number>(-?\d+(\.\d+)?)|(-?\.\d+))$')),
    ("Int with suffix",
     pg.SpinBox(value=999, step=1, int=True, suffix="V")),
    ("Int with custom formatting",
     pg.SpinBox(value=4567, step=1, int=True, bounds=[0,None], format='0x{value:X}',
                regex='(0x)?(?P<number>[0-9a-fA-F]+)$',
                evalFunc=lambda s: ast.literal_eval('0x'+s))),
    ("Integer with bounds=[10, 20] and wrapping",
     pg.SpinBox(value=10, bounds=[10, 20], int=True, minStep=1, step=1, wrapping=True)),
]


win = QtWidgets.QMainWindow()
win.setWindowTitle('pyqtgraph example: SpinBox')
cw = QtWidgets.QWidget()
layout = QtWidgets.QGridLayout()
cw.setLayout(layout)
win.setCentralWidget(cw)
win.show()
#win.resize(300, 600)
changingLabel = QtWidgets.QLabel()  ## updated immediately
changedLabel = QtWidgets.QLabel()   ## updated only when editing is finished or mouse wheel has stopped for 0.3sec
changingLabel.setMinimumWidth(200)
font = changingLabel.font()
font.setBold(True)
font.setPointSize(14)
changingLabel.setFont(font)
changedLabel.setFont(font)
labels = []


def valueChanged(sb):
    changedLabel.setText("Final value: %s" % str(sb.value()))

def valueChanging(sb, value):
    changingLabel.setText("Value changing: %s" % str(sb.value()))


for text, spin in spins:
    label = QtWidgets.QLabel(text)
    labels.append(label)
    layout.addWidget(label)
    layout.addWidget(spin)
    spin.sigValueChanged.connect(valueChanged)
    spin.sigValueChanging.connect(valueChanging)

layout.addWidget(changingLabel, 0, 1)
layout.addWidget(changedLabel, 2, 1)


#def mkWin():
    #win = QtWidgets.QMainWindow()
    #g = QtWidgets.QFormLayout()
    #w = QtWidgets.QWidget()
    #w.setLayout(g)
    #win.setCentralWidget(w)
    #s1 = SpinBox(value=5, step=0.1, bounds=[-1.5, None], suffix='units')
    #t1 = QtWidgets.QLineEdit()
    #g.addRow(s1, t1)
    #s2 = SpinBox(value=10e-6, dec=True, step=0.1, minStep=1e-6, suffix='A', siPrefix=True)
    #t2 = QtWidgets.QLineEdit()
    #g.addRow(s2, t2)
    #s3 = SpinBox(value=1000, dec=True, step=0.5, minStep=1e-6, bounds=[1, 1e9], suffix='Hz', siPrefix=True)
    #t3 = QtWidgets.QLineEdit()
    #g.addRow(s3, t3)
    #s4 = SpinBox(int=True, dec=True, step=1, minStep=1, bounds=[-10, 1000])
    #t4 = QtWidgets.QLineEdit()
    #g.addRow(s4, t4)

    #win.show()

    #import sys
    #for sb in [s1, s2, s3,s4]:

        ##QtCore.QObject.connect(sb, QtCore.SIGNAL('valueChanged(double)'), lambda v: sys.stdout.write(str(sb) + " valueChanged\n"))
        ##QtCore.QObject.connect(sb, QtCore.SIGNAL('editingFinished()'), lambda: sys.stdout.write(str(sb) + " editingFinished\n"))
        #sb.sigValueChanged.connect(valueChanged)
        #sb.sigValueChanging.connect(valueChanging)
        #sb.editingFinished.connect(lambda: sys.stdout.write(str(sb) + " editingFinished\n"))
    #return win, w, [s1, s2, s3, s4]
#a = mkWin()


#def test(n=100):
    #for i in range(n):
        #win, w, sb = mkWin()
        #for s in sb:
            #w.setParent(None)
            #s.setParent(None)
            #s.valueChanged.disconnect()
            #s.editingFinished.disconnect()


if __name__ == '__main__':
    pg.exec()
ConsoleWidgets
"""
ConsoleWidget is used to allow execution of user-supplied python commands
in an application. It also includes a command history and functionality for trapping
and inspecting stack traces.

"""

import numpy as np

import pyqtgraph as pg
import pyqtgraph.console

app = pg.mkQApp()

## build an initial namespace for console commands to be executed in (this is optional;
## the user can always import these modules manually)
namespace = {'pg': pg, 'np': np}

## initial text to display in the console
text = """
This is an interactive python console. The numpy and pyqtgraph modules have already been imported
as 'np' and 'pg'.

Go, play.
"""
c = pyqtgraph.console.ConsoleWidget(namespace=namespace, text=text)
c.show()
c.setWindowTitle('pyqtgraph example: ConsoleWidget')

if __name__ == '__main__':
    pg.exec()
Histogram / lookup table
"""
Use a HistogramLUTWidget to control the contrast / coloration of an image.
"""

import numpy as np

import pyqtgraph as pg
from pyqtgraph.Qt import QtWidgets

app = pg.mkQApp("Histogram Lookup Table Example")
win = QtWidgets.QMainWindow()
win.resize(880, 600)
win.show()
win.setWindowTitle('pyqtgraph example: Histogram LUT')

cw = QtWidgets.QWidget()
win.setCentralWidget(cw)

layout = QtWidgets.QGridLayout()
cw.setLayout(layout)
layout.setSpacing(0)

view = pg.GraphicsView()
vb = pg.ViewBox()
vb.setAspectLocked()
view.setCentralItem(vb)
layout.addWidget(view, 0, 1, 3, 1)

hist = pg.HistogramLUTWidget(gradientPosition="left")
layout.addWidget(hist, 0, 2)


monoRadio = QtWidgets.QRadioButton('mono')
rgbaRadio = QtWidgets.QRadioButton('rgba')
layout.addWidget(monoRadio, 1, 2)
layout.addWidget(rgbaRadio, 2, 2)
monoRadio.setChecked(True)


def setLevelMode():
    mode = 'mono' if monoRadio.isChecked() else 'rgba'
    hist.setLevelMode(mode)


monoRadio.toggled.connect(setLevelMode)

data = pg.gaussianFilter(np.random.normal(size=(256, 256, 3)), (20, 20, 0))
for i in range(32):
    for j in range(32):
        data[i*8, j*8] += .1
img = pg.ImageItem(data)
vb.addItem(img)
vb.autoRange()

hist.setImageItem(img)

if __name__ == '__main__':
    pg.exec()
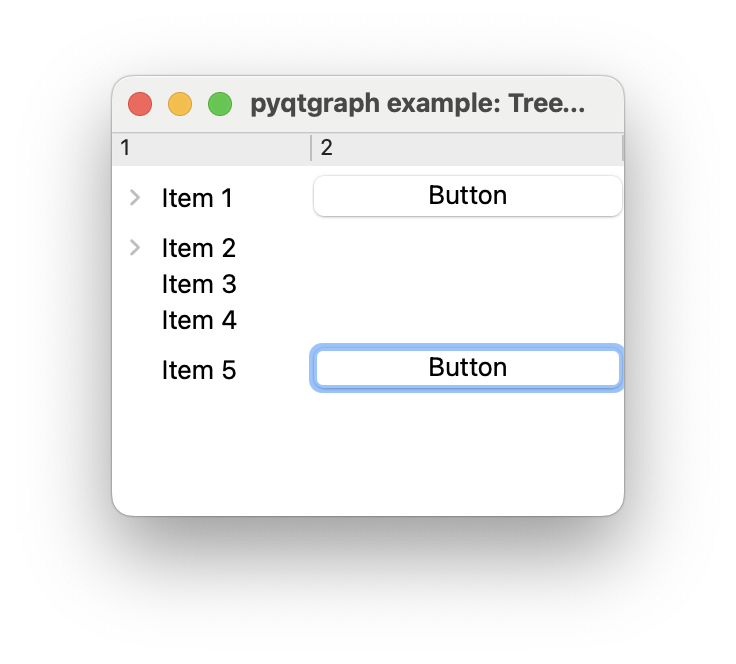
TreeWidget
"""
Simple demonstration of TreeWidget, which is an extension of QTreeWidget
that allows widgets to be added and dragged within the tree more easily.
"""


import pyqtgraph as pg
from pyqtgraph.Qt import QtWidgets

app = pg.mkQApp("TreeWidget Example")

w = pg.TreeWidget()
w.setColumnCount(2)
w.show()
w.setWindowTitle('pyqtgraph example: TreeWidget')

i1  = QtWidgets.QTreeWidgetItem(["Item 1"])
i11  = QtWidgets.QTreeWidgetItem(["Item 1.1"])
i12  = QtWidgets.QTreeWidgetItem(["Item 1.2"])
i2  = QtWidgets.QTreeWidgetItem(["Item 2"])
i21  = QtWidgets.QTreeWidgetItem(["Item 2.1"])
i211  = pg.TreeWidgetItem(["Item 2.1.1"])
i212  = pg.TreeWidgetItem(["Item 2.1.2"])
i22  = pg.TreeWidgetItem(["Item 2.2"])
i3  = pg.TreeWidgetItem(["Item 3"])
i4  = pg.TreeWidgetItem(["Item 4"])
i5  = pg.TreeWidgetItem(["Item 5"])
b5 = QtWidgets.QPushButton('Button')
i5.setWidget(1, b5)


w.addTopLevelItem(i1)
w.addTopLevelItem(i2)
w.addTopLevelItem(i3)
w.addTopLevelItem(i4)
w.addTopLevelItem(i5)
i1.addChild(i11)
i1.addChild(i12)
i2.addChild(i21)
i21.addChild(i211)
i21.addChild(i212)
i2.addChild(i22)

b1 = QtWidgets.QPushButton("Button")
w.setItemWidget(i1, 1, b1)

if __name__ == '__main__':
    pg.exec()
ScatterPlotWidgets
"""
Demonstration of ScatterPlotWidget for exploring structure in tabular data.

The widget consists of four components:

1) A list of column names from which the user may select 1 or 2 columns
    to plot. If one column is selected, the data for that column will be
    plotted in a histogram-like manner by using pg.pseudoScatter().
    If two columns are selected, then the
    scatter plot will be generated with x determined by the first column
    that was selected and y by the second.
2) A DataFilter that allows the user to select a subset of the data by
    specifying multiple selection criteria.
3) A ColorMap that allows the user to determine how points are colored by
    specifying multiple criteria.
4) A PlotWidget for displaying the data.

"""

import numpy as np

import pyqtgraph as pg

pg.mkQApp()

# Make up some tabular data with structure
data = np.empty(1000, dtype=[('x_pos', float), ('y_pos', float),
                             ('count', int), ('amplitude', float),
                             ('decay', float), ('type', 'U10')])
strings = ['Type-A', 'Type-B', 'Type-C', 'Type-D', 'Type-E']
typeInds = np.random.randint(5, size=1000)
data['type'] = np.array(strings)[typeInds]
data['x_pos'] = np.random.normal(size=1000)
data['x_pos'][data['type'] == 'Type-A'] -= 1
data['x_pos'][data['type'] == 'Type-B'] -= 1
data['x_pos'][data['type'] == 'Type-C'] += 2
data['x_pos'][data['type'] == 'Type-D'] += 2
data['x_pos'][data['type'] == 'Type-E'] += 2
data['y_pos'] = np.random.normal(size=1000) + data['x_pos']*0.1
data['y_pos'][data['type'] == 'Type-A'] += 3
data['y_pos'][data['type'] == 'Type-B'] += 3
data['amplitude'] = data['x_pos'] * 1.4 + data['y_pos'] + np.random.normal(size=1000, scale=0.4)
data['count'] = (np.random.exponential(size=1000, scale=100) * data['x_pos']).astype(int)
data['decay'] = np.random.normal(size=1000, scale=1e-3) + data['amplitude'] * 1e-4
data['decay'][data['type'] == 'Type-A'] /= 2
data['decay'][data['type'] == 'Type-E'] *= 3


# Create ScatterPlotWidget and configure its fields
spw = pg.ScatterPlotWidget()
spw.setFields([
    ('x_pos', {'units': 'm'}),
    ('y_pos', {'units': 'm'}),
    ('count', {}),
    ('amplitude', {'units': 'V'}),
    ('decay', {'units': 's'}),
    ('type', {'mode': 'enum', 'values': strings}),
    ])

spw.setData(data)
spw.show()

if __name__ == '__main__':
    pg.exec()
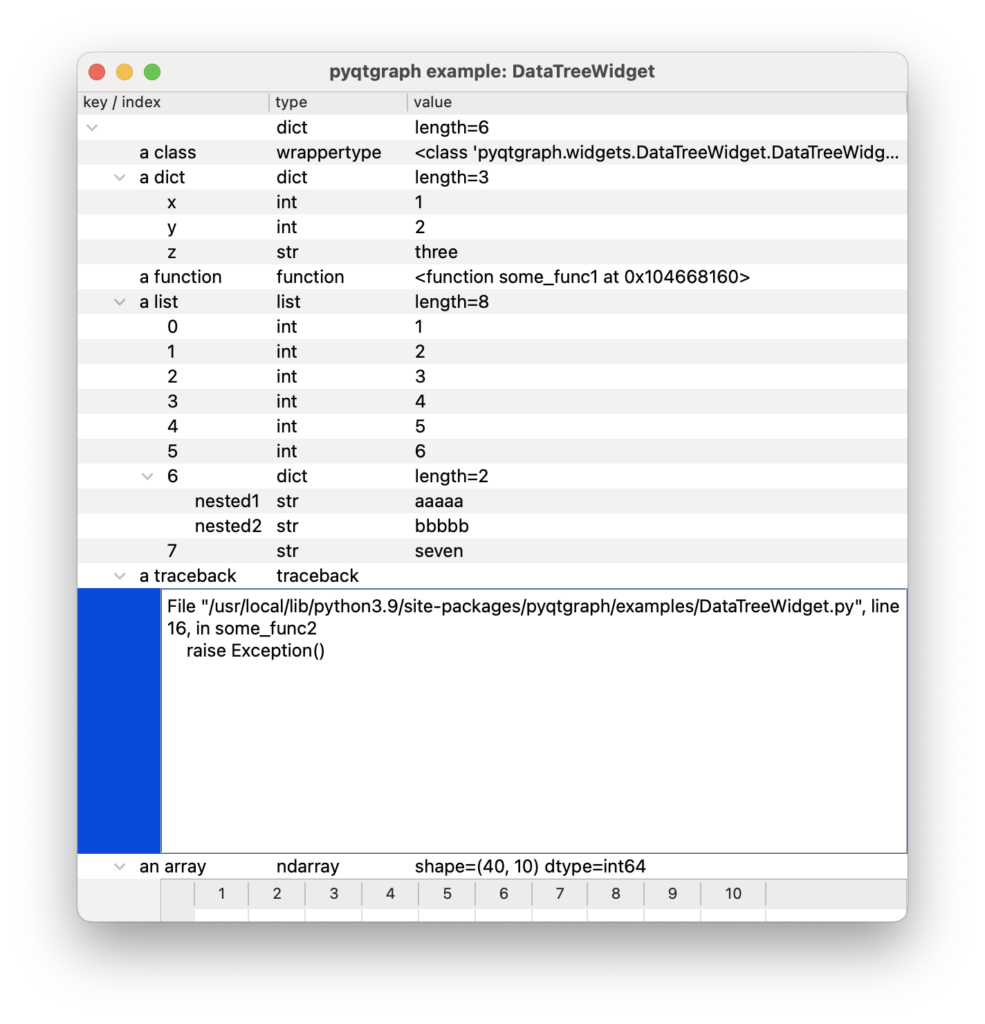
DataTreeWidget
"""
Simple use of DataTreeWidget to display a structure of nested dicts, lists, and arrays
"""

import numpy as np

import pyqtgraph as pg


# for generating a traceback object to display
def some_func1():
    return some_func2()
def some_func2():
    try:
        raise Exception()
    except:
        import sys
        return sys.exc_info()[2]


app = pg.mkQApp("DataTreeWidget Example")
d = {
    'a list': [1,2,3,4,5,6, {'nested1': 'aaaaa', 'nested2': 'bbbbb'}, "seven"],
    'a dict': {
        'x': 1,
        'y': 2,
        'z': 'three'
    },
    'an array': np.random.randint(10, size=(40,10)),
    'a traceback': some_func1(),
    'a function': some_func1,
    'a class': pg.DataTreeWidget,
}

tree = pg.DataTreeWidget(data=d)
tree.show()
tree.setWindowTitle('pyqtgraph example: DataTreeWidget')
tree.resize(600,600)


if __name__ == '__main__':
    pg.exec()
GradientWidget
"""
Demonstrates the appearance / interactivity of GradientWidget
(without actually doing anything useful with it)
"""


import pyqtgraph as pg
from pyqtgraph.Qt import QtWidgets

app = pg.mkQApp("Gradiant Widget Example")
w = QtWidgets.QMainWindow()
w.show()
w.setWindowTitle('pyqtgraph example: GradientWidget')
w.setGeometry(10, 50, 400, 400)
cw = QtWidgets.QWidget()
w.setCentralWidget(cw)

l = QtWidgets.QGridLayout()
l.setSpacing(0)
cw.setLayout(l)

w1 = pg.GradientWidget(orientation='top')
w2 = pg.GradientWidget(orientation='right', allowAdd=False)
#w2.setTickColor(1, QtGui.QColor(255,255,255))
w3 = pg.GradientWidget(orientation='bottom', allowAdd=False, allowRemove=False)
w4 = pg.GradientWidget(orientation='left')
w4.loadPreset('spectrum')
label = QtWidgets.QLabel("""
- Click a triangle to change its color
- Drag triangles to move
- Right-click a gradient to load triangle presets
- Click in an empty area to add a new color
    (adding is disabled for the bottom-side and right-side widgets)
- Right click a triangle to remove
    (only possible if more than two triangles are visible)
    (removing is disabled for the bottom-side widget)
""")

l.addWidget(w1, 0, 1)
l.addWidget(w2, 1, 2)
l.addWidget(w3, 2, 1)
l.addWidget(w4, 1, 0)
l.addWidget(label, 1, 1)

if __name__ == '__main__':
    pg.exec()
TableWidget
"""
Simple demonstration of TableWidget, which is an extension of QTableWidget
that automatically displays a variety of tabluar data formats.
"""

import numpy as np

import pyqtgraph as pg

app = pg.mkQApp("Table Widget Example")

w = pg.TableWidget()
w.show()
w.resize(500,500)
w.setWindowTitle('pyqtgraph example: TableWidget')


data = np.array([
    (1,   1.6,   'x'),
    (3,   5.4,   'y'),
    (8,   12.5,  'z'),
    (443, 1e-12, 'w'),
    ], dtype=[('Column 1', int), ('Column 2', float), ('Column 3', object)])

w.setData(data)

if __name__ == '__main__':
    pg.exec()
ColorButton
"""
Simple example demonstrating a button which displays a colored rectangle
and allows the user to select a new color by clicking on the button.
"""


import pyqtgraph as pg
from pyqtgraph.Qt import QtWidgets

app = pg.mkQApp("ColorButton Example")
win = QtWidgets.QMainWindow()
btn = pg.ColorButton()
win.setCentralWidget(btn)
win.show()
win.setWindowTitle('pyqtgraph example: ColorButton')

def change(btn):
    print("change", btn.color())
def done(btn):
    print("done", btn.color())

btn.sigColorChanging.connect(change)
btn.sigColorChanged.connect(done)

if __name__ == '__main__':
    pg.exec()
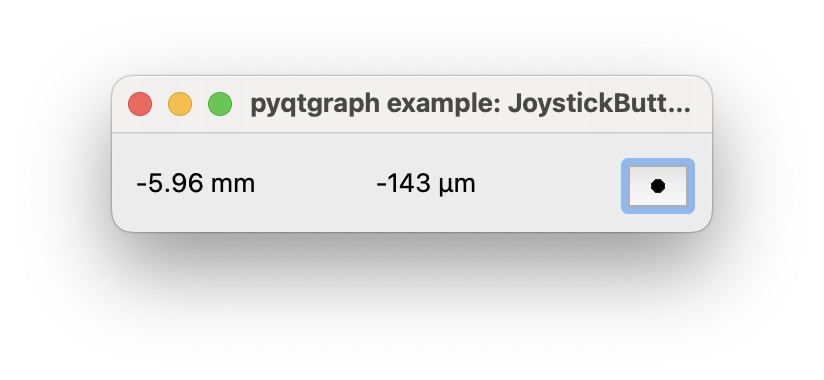
JoystickButton
"""
JoystickButton is a button with x/y values. When the button is depressed and the
mouse dragged, the x/y values change to follow the mouse.
When the mouse button is released, the x/y values change to 0,0 (rather like
letting go of the joystick).
"""

import pyqtgraph as pg
from pyqtgraph.Qt import QtCore, QtWidgets

app = pg.mkQApp("Joystick Button Example")
mw = QtWidgets.QMainWindow()
mw.resize(300,50)
mw.setWindowTitle('pyqtgraph example: JoystickButton')
cw = QtWidgets.QWidget()
mw.setCentralWidget(cw)
layout = QtWidgets.QGridLayout()
cw.setLayout(layout)
mw.show()

l1 = pg.ValueLabel(siPrefix=True, suffix='m')
l2 = pg.ValueLabel(siPrefix=True, suffix='m')
jb = pg.JoystickButton()
jb.setFixedWidth(30)
jb.setFixedHeight(30)


layout.addWidget(l1, 0, 0)
layout.addWidget(l2, 0, 1)
layout.addWidget(jb, 0, 2)

x = 0
y = 0
def update():
    global x, y, l1, l2, jb
    dx, dy = jb.getState()
    x += dx * 1e-3
    y += dy * 1e-3
    l1.setValue(x)
    l2.setValue(y)
timer = QtCore.QTimer()
timer.timeout.connect(update)
timer.start(30)

if __name__ == '__main__':
    pg.exec()


コメント