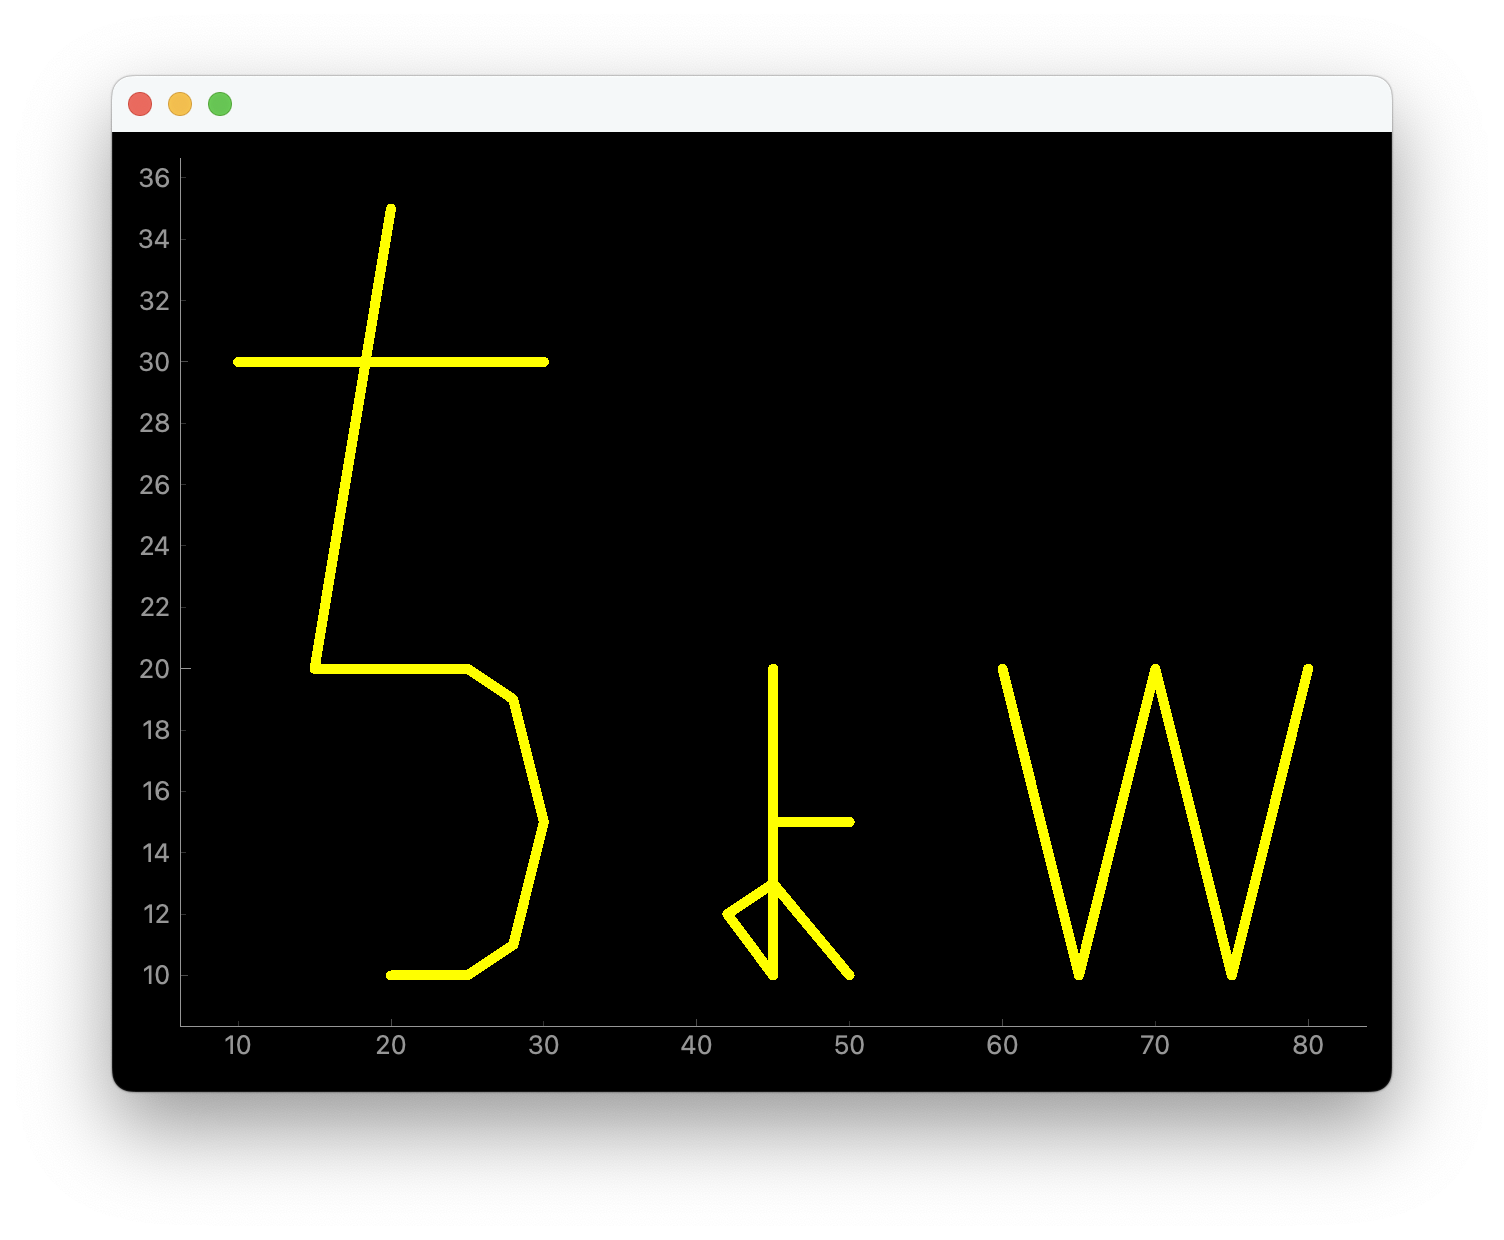
PyQtGraphで「ちょw」を描画する方法を説明する。
完成イメージ
結論
グラフの線が「ちょw」になるようにする。
#!/usr/bin/env python3

import sys
from PyQt6.QtWidgets import QApplication, QWidget
import pyqtgraph as pg


class GuiWindow(QWidget):

    def __init__(self, parent=None):
        super().__init__(parent)
        self.グラフを描画する()

    def グラフを描画する(self):
        self.graph = pg.GraphicsLayoutWidget(show=True)
        self.graph.move(0,0)
        self.p = self.graph.addPlot()
        self.p.plot(x=[10, 30],
                    y=[30, 30], pen='y')
        self.p.plot(x=[20, 15],
                    y=[35, 20], pen='y')
        self.p.plot(x=[15, 25, 28, 30, 28, 25, 20],
                    y=[20, 20, 19, 15, 11, 10, 10], pen='y')
        self.p.plot(x=[45, 50],
                    y=[15, 15], pen='y')
        self.p.plot(x=[45, 45],
                    y=[20, 10], pen='y')
        self.p.plot(x=[45, 42, 45],
                    y=[10, 12, 13], pen='y')
        self.p.plot(x=[45, 50],
                    y=[13, 10], pen='y')
        self.p.plot(x=[60, 65, 70, 75, 80],
                    y=[20, 10, 20, 10, 20], pen='y')


if __name__ == '__main__':
    app = QApplication(sys.argv)
    window = GuiWindow()
    sys.exit(app.exec())
まとめ
PyQtGraphで「ちょw」を描画する方法を説明した。


コメント